Many Splunk users find themselves standing up a “syslog box,” for the purpose of receiving syslog inputs, writing them to disk, running a universal forwarder, monitoring those files that you just created, reading in those files, then sending the data off to the indexer cluster. Why not cut out the middlemen and use Splunk as a direct syslog replacement? It’s not dead-simple, especially in a clustered environment, but it’s not TOO hard…
For this I’m making a couple of assumptions (that happen to match the environment at my current workplace, but I don’t think they’re unreasonable assumptions):
- You have a decent number of Splunk indexers, enough that you can be confident that your environment will be always-up. (i.e. you’ll never have so many of them down that events are likely to get lost for an extended period)
- You have a load-balancer, either a commercial one, (F5, Netscaler, etc) or the know-how to build one. (nginx, not haproxy as it doesn’t support UDP)
- You know at least enough about regular expressions to be dangerous 🤣
I’m going to start from the outside and work my way in.
Data Sources
For the sake of making my life easy and keeping this relatively simple, I’m not even touching TCP syslog. We’re only using UDP. (This would probably work over TCP just fine, but I haven’t tested it.)
You’ll have to configure your data sources to point to your load balancer’s virtual server, presumably with the standard syslog settings (UDP port 514). The details vary by data source, but almost everything supports syslog, and in most cases “UDP/514” is the default anyway.
Load Balancing
You’ll need a standard virtual server, on an IP that’s accessible to your devices, and ideally no others. I doubt that many spammers are using syslog for spam, but I’m not eager to test that theory. Thus my virtual server is on an internal RFC1918 IP. (I mainly use Splunk for internal infrastructure like routers and firewalls so this isn’t limiting.)
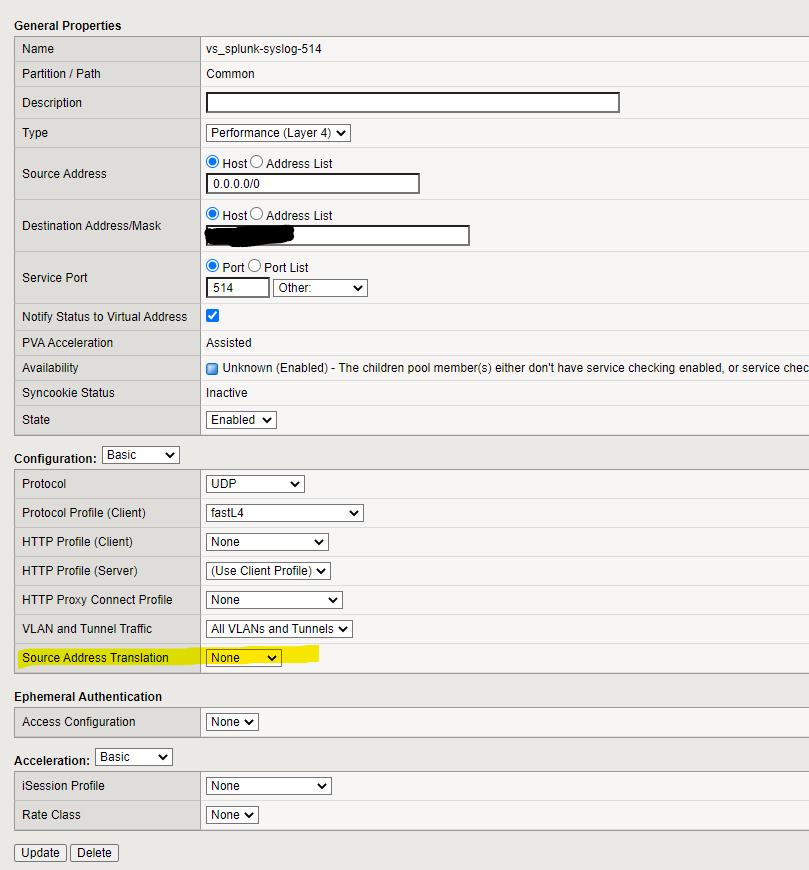
You’ll want your load balancer to be highly available, with some sort of floating-IP mechanism. (I think every major vendor supports this. If you’re rolling your own, you’ll need to learn about heartbeats and other tricky parts of networking that honestly scare me.) The virtual server should listen on UDP/514, and you’ll want to disable any source address translation. If you forget that step, every event you have coming in will appear to come from your load balancer, not the “real” source, and that makes the logged data substantially less useful.
If your load balancer does health checks, you’ll have to settle for something that’s not service-specific (since UDP is basically a dumb listener). I simply do ping checks on all the indexers, every 5-10 seconds. Yes, this means that if an individual indexer fails, some events can get lost (as the load balancer sends them to a dead indexer before the pings pick up the failure and reroute traffic). I’d love to know a better way to handle that case.
I’ve configured the load balancer to do port translation — requests come in from data sources to the F5 on port 514, but are routed to port 5140 on the indexers. That way, the Splunk UDP listener won’t inadvertently step on any syslog listener that may already exist on the indexer host.
The F5 pool and virtual server look like this:
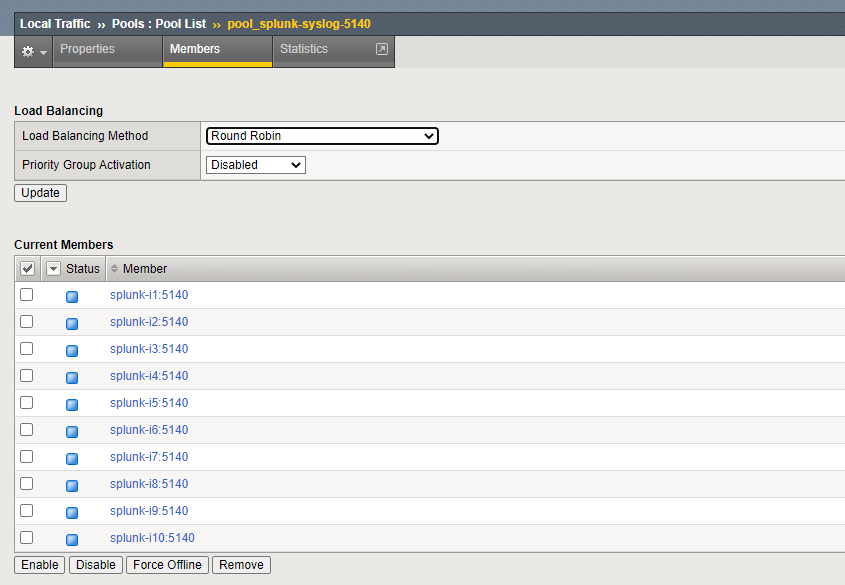
Fairly straightforward stuff. Not shown above is session stickiness/persistence. I’d suggest sticking sessions based on the client IP. (If your network is large enough that you’re doing this, there should be enough diversity in source addresses that the load will be more-or-less evenly distributed.)
Splunk
On the Splunk side, you need to add three configuration files to get the data in, and to save it where you’d like it to go. I’m assuming you have a Splunk cluster master, that you can use to push an app to your indexers. I created a shiny new cluster app on my cluster master in $SPLUNK_HOME/etc/master-apps/syslog_listener/ and put the below config files in that app’s local/ subdirectory.
inputs.conf
One of the most basic inputs.conf files you’ll ever see.
[udp:5140]
disabled = 0
connection_host = ip
That’s it. Just those three lines. (When developing this, I had originally specified a source and sourcetype in inputs.conf, and that prevented the props and transforms from working. This is all you need.)
props.conf
Then. you’ll need a props.conf, that looks at those incoming events and specifies one transform for each unique “thing you want to do” with the incoming events. I started using this originally to look at a certain kind of F5 events, so my props.conf looks like this:
[source::udp:5140]
TRANSFORMS-syslog_overrides = override_index_f5conn, override_sourcetype_f5conn
The transform names should be fairly self-explanatory — I want to override the index (so data doesn’t land in main), and override the sourcetype (which will likely default to syslog).
You’ll want one item for each transform. Transforms are executed in the order listed here, in props.conf, not transforms.conf. If you build up a really complex environment with a lot of different transforms, you should take extra care as you add new data sources to ensure your events aren’t mis-labeled or mis-indexed.
transforms.conf
Last, transforms.conf. This is by far the quirkiest of the files, because the actions can be formatted differently depending on what you’re actually doing. Here’s mine, based on the above props.conf:
[override_index_f5conn]
SOURCE_KEY = _raw
REGEX = f5\-svc\-ip\=
DEST_KEY = _MetaData:Index
FORMAT = f5_connection_log

[override_sourcetype_f5conn]
SOURCE_KEY = _raw
REGEX = f5\-svc\-ip\=
DEST_KEY = MetaData:Sourcetype
FORMAT = sourcetype::f5:connection-log
Transforms are a bit weird, so here’s what you’re looking at:
- The
SOURCE_KEYis “what data am I looking at”. That’s usually going to be_raw, which is the full raw event as it came in from the syslog data source. Using_rawis the default, but I like to be explicit, so I list it here. REGEXis just what it sounds like — a regular expression that will be run on the data inSOURCE_KEY. In this case I’m looking for the string “f5-svc-ip=” and added extra escapes because I’m paranoid.- The
DEST_KEYis “if the regex matches, what part of the event should I modify”. You can modify the text of the event itself, or just about any metadata related to the event. Note that some metadata fields are name_MetaData:Foo(with a leading underscore), others are namedMetaData:Foo(without that leading underscore). I haven’t really figured out a pattern to this, so just check the transforms.conf documentation. FORMATis “what is the actual change I should make to the event”. Again, for someDEST_KEYvalues, this is plaintext (or plaintext with a regex callback), for others it requires some extra flavor (such as the source type requiring you to saysourcetype::foo:bareven though theDEST_KEYis “Sourcetype”). Again the transforms.conf documentation is key.
There’s a lot more you can do here, but in my use over the past couple months, I have yet to do anything other than “update a sourcetype” and “update an index”.
Once all this is done, just push the app out like any other new indexer cluster app. As you’re adding a listener, this is likely to trigger a rolling restart of your indexers. You may want to do this after-hours or in a maintenance window.
Testing
For testing, before actually updating data sources to point to the load balancer, I use the “logger” tool, which is widely available on most Linux distributions. Here’s an event I’ve used to test the above:
logger -n 10.20.30.1 --rfc3164 "f5-svc-ip=1.2.3.4, f5-svc-port=636, externalip=2.3.4.5, externalport=12345, internalip=5.6.7.8, internalport=23456"The above simulates a message coming from one of our F5s. (The message itself comes from a custom F5 irule, but that’s a subject for another blog post…)
If you’re lucky, you’ll then go look at the index you specified and see the event you sent in. Be sure your test event matches the regex you set up in transforms.conf, or else it won’t match (and will likely land in the main index).
Credits
This blog post was largely based on this Splunk Community post (in which I asked basically this same question, and then ultimately answered it).